Basal Body Temperature (BBT) Charting: A Practitioner's Guide to Reading Your Cycle
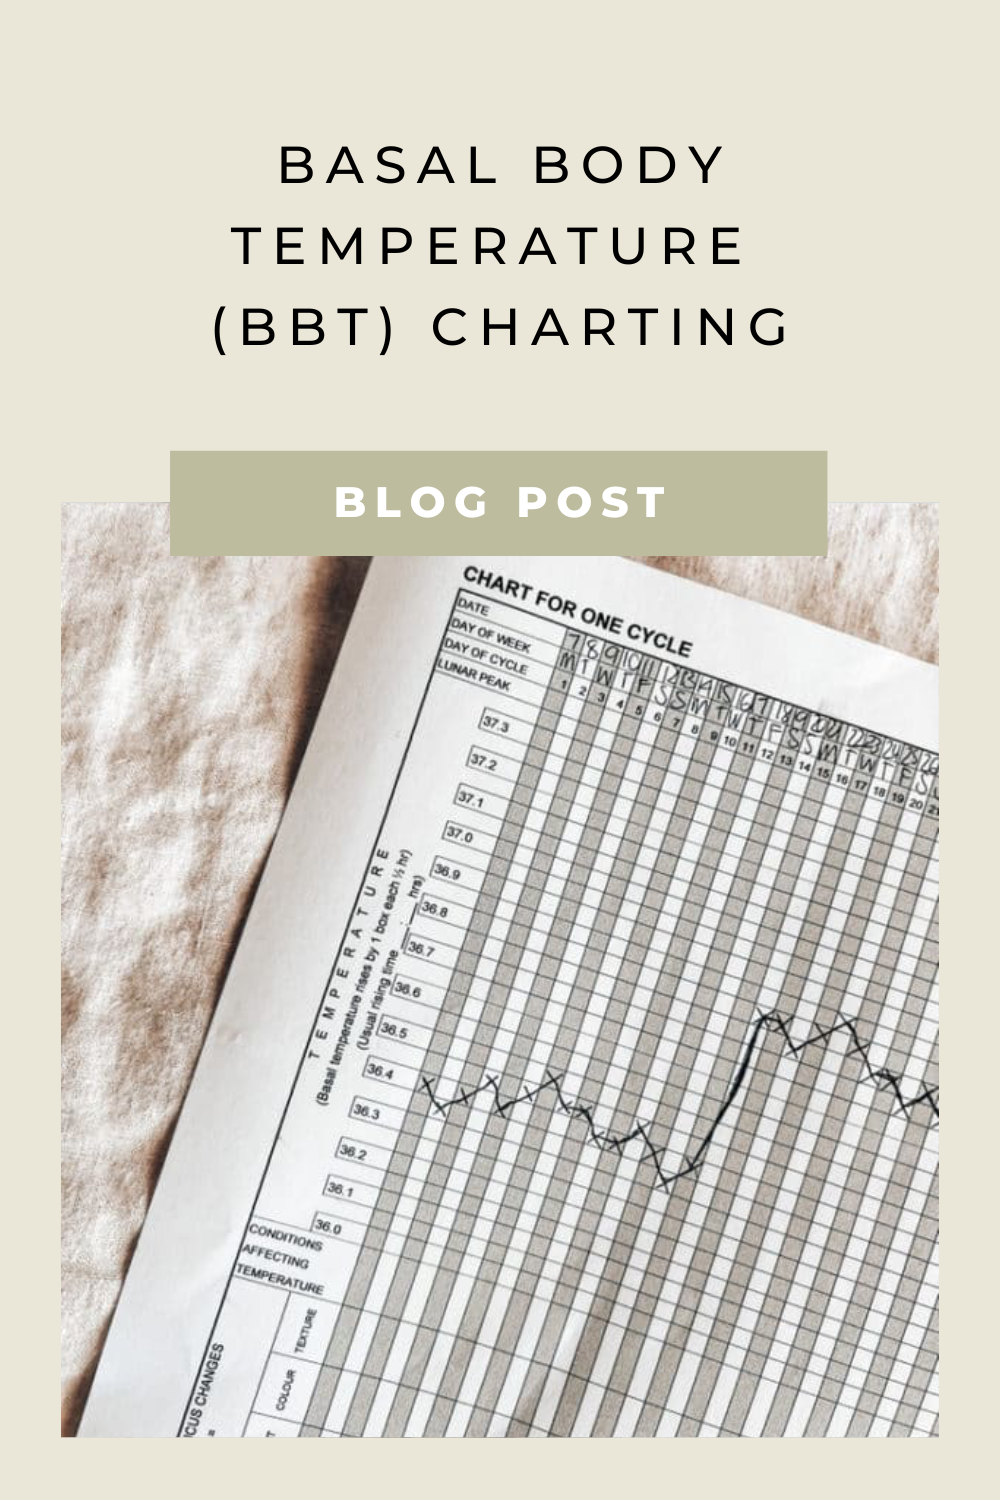
There is a vital rhythm underneath the menstrual cycle that the eye cannot see but the thermometer can. Basal body temperature, or BBT, is that rhythm made visible. Tracked daily, it becomes a quiet record of ovulation, hormonal shifts, and the deeper patterns of reproductive health.
This is a practice I use with every fertility client in my clinic. It is one of the simplest tools available, and consistently one of the most revealing.
What Basal Body Temperature Actually Measures
Basal body temperature is the lowest resting temperature your body reaches, typically measured immediately upon waking, before any movement, talking, or activity raises it even slightly.
Across a healthy cycle, BBT moves in two distinct phases:
Follicular phase (before ovulation) Temperatures sit lower, generally between 36.0°C and 36.6°C, while estrogen dominates.
Luteal phase (after ovulation) Progesterone rises after ovulation and lifts the temperature by roughly 0.2°C to 0.5°C, holding it higher until menstruation begins or, if conception occurs, continuing to climb.
This shift, known as the thermal shift, is the signature of ovulation. It confirms, after the fact, that an egg was released.
Why Chart BBT?
Confirm ovulation. A sustained rise in temperature for three or more days is the clearest sign that ovulation has occurred. Many other fertility signs suggest ovulation is approaching; BBT confirms it happened.
Identify your luteal phase length. A healthy luteal phase runs 11 to 16 days. A consistently short luteal phase can point to progesterone insufficiency, a pattern worth investigating with a practitioner, particularly for those trying to conceive or experiencing early miscarriage.
Time intercourse or insemination. While BBT rises after ovulation rather than before it, months of consistent charting reveal your personal pattern, allowing you to more accurately anticipate your fertile window in future cycles.
Notice irregularities early. Anovulatory cycles, erratic hormone patterns, or thyroid dysfunction often show up in a chart before they show up as a diagnosis. A biphasic pattern that never quite forms, erratic temperatures, or a slow, staggered rise instead of a clean shift, are all important diagnostic features.
Understand your body beyond fertility. For those not trying to conceive, BBT charting still offers insight into hormonal balance, cycle regularity, and overall reproductive health. The underlying pattern for some of your symptoms may also be revealed here. In Traditional Chinese Medicine, this data complements what we already read in the pulse and tongue, giving a fuller picture of yin and yang movement through the month.
How to Chart Basal Body Temperature
Take your temperature first thing in the morning. Before rising, before going to the bathroom, before drinking water, before reaching for your phone for anything other than the thermometer itself. Place your thermometer on top of your phone or alarm overnight, since this is usually the first thing you reach for on waking, and it becomes a natural cue.
Sleep in an uninterrupted four-hour block beforehand. Anything less and the reading will not reflect true basal temperature. If you wake during the night to urinate, that is fine as long as you have already had a solid four-hour stretch beforehand, for example 10pm to 2am, you may take your temperature then.
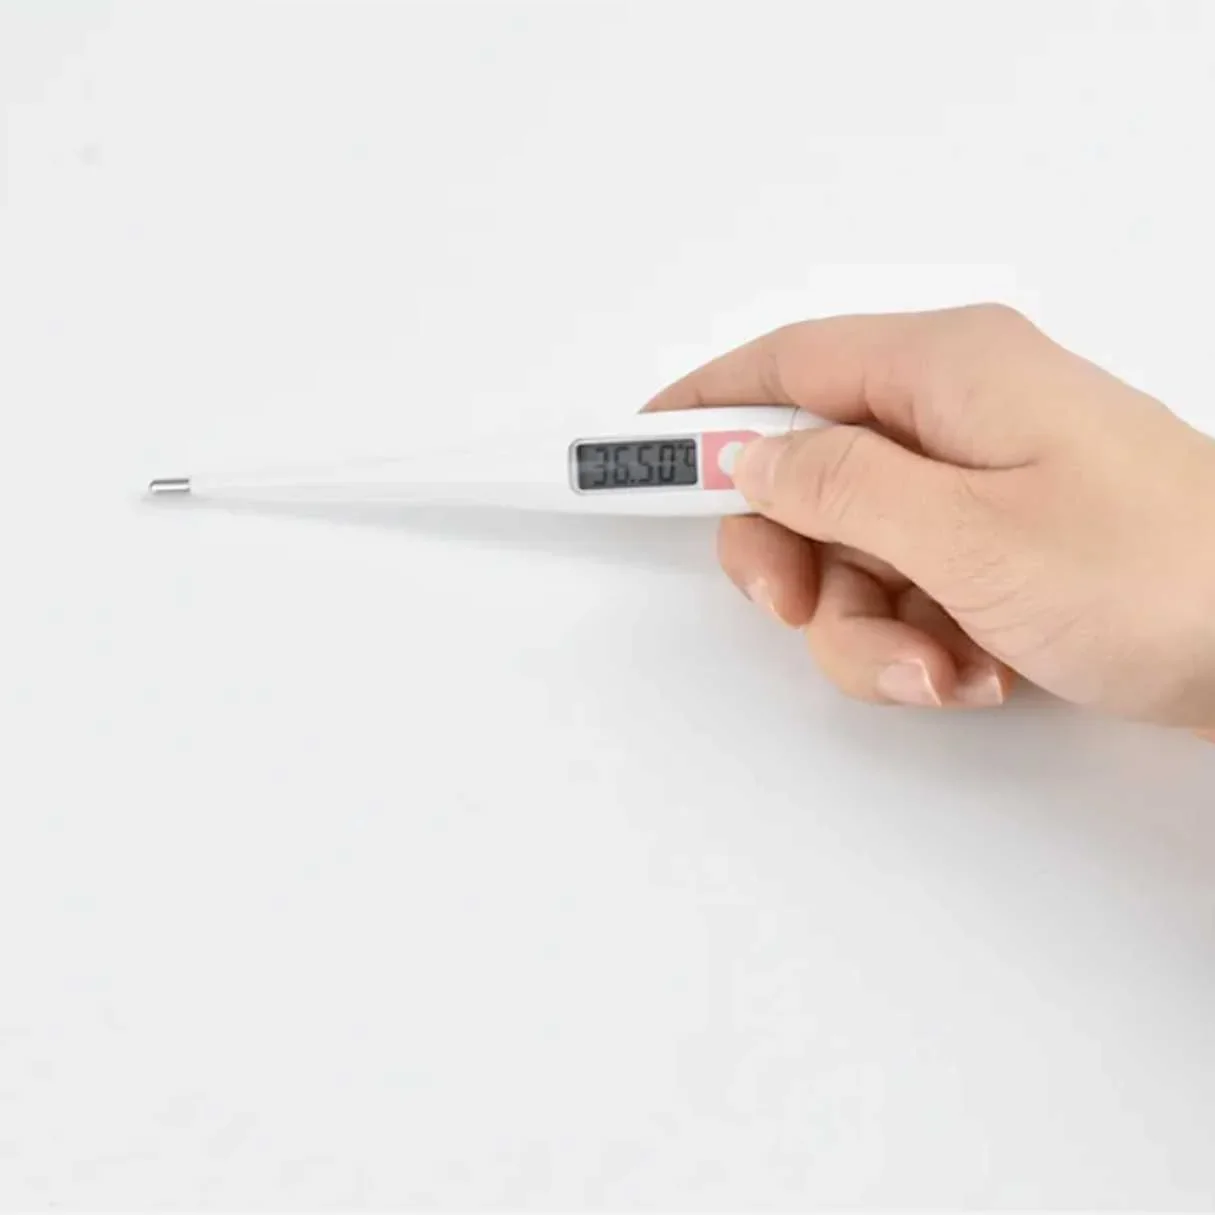
Take your temperature sublingually, under the tongue. If you are a mouth breather during sleep, sublingual readings will not be accurate, and you will need to take your temperature vaginally instead. Another more practical option is using a device like the Temp Drop (more info below).
Take it at the same time daily, without gaps. Consistency is what reveals the pattern. Note anything that might affect a reading: alcohol, fever, illness, poor sleep, travel, or unusual stress, since all of these will shift your temperature independently of your cycle.
Check that your thermometer is working correctly. A thermometer that has lost accuracy or is inconsistent between readings will quietly undermine the whole chart.
Plot your temperatures into a chart. Whether by hand or through an app (I often recommend Fertility Friend), the goal is a visual line across your cycle that makes the shift from low to high easy to see and easy to discuss with your practitioner.
A Note on Method
Charting by hand, on paper, has its own quiet value. It slows you down and asks you to sit with your own data each morning. But it also invites human error: a forgotten reading, an unsteady hand with the decimal point, a late wake time that skews the number.
Most people now chart through an app rather than paper, entering each morning's reading into a program like Fertility Friend, which builds the chart for you and makes the ovulatory shift easy to spot at a glance. This is especially useful if you are working with a practitioner, as it turns weeks of raw numbers into a single chart you can review together.
For those who want to remove the manual reading altogether, wearable temperature devices have become a popular next step. One such option is Temp Drop, a small sensor worn overnight that captures temperature continuously while you sleep and syncs directly to its app, smoothing out the natural noise of a single waking measurement and removing the need to reach for a thermometer at all. It pairs well with fertility awareness charting and can be a helpful option for those who want the insight of BBT tracking without the strict wake-time discipline manual charting requires.
I use Temp Drop with my own fertility clients. This is my affiliate link, if you purchase through it you'll receive 10% off - http://www.tempdrop.com/discount/AFVERONIKA
Whatever method you choose, the practice itself is what matters. Morning after morning, the temperature reading offers a small, steady conversation with your own physiology, one degree at a time.
A chart on its own is only data. A skilled women's health or fertility practitioner is what turns that data into meaning, reading the shape of your temperatures alongside your cycle history, your symptoms, and your wider health picture. Personally, this is where charting becomes most valuable in my own practice: it informs my treatment protocols, so I know they are suited to the actual rhythm of your hormones, not a generic textbook cycle.
This article is for educational purposes and is not a substitute for individualised care.
If you are trying to conceive, tracking irregular cycles, or navigating a suspected hormonal imbalance, working with a qualified practitioner alongside your charting can offer far more clarity than the numbers alone - Book an appointment to get started!

Veronika Peovska
(BHSc Acupuncture)
“To be skilled at nurturing one’s nature and wellbeing is to treat disease before it arises.” - SUN SIMIAO